
Capture a Network Trace without installing anything (& capture a network trace of a reboot)
If you need to capture a network trace of a client or server without installing Wireshark or Netmon this might be helpful for you. (This feature works on Windows 7/2008 R2 and above).
The short version:
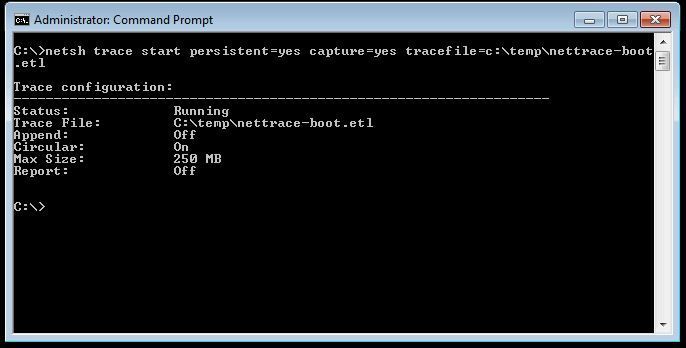
1. Open an elevated command prompt and run: “netsh trace start persistent=yes capture=yes tracefile=c:\temp\nettrace-boot.etl” (make sure you have a \temp directory or choose another location).
2. Reproduce the issue or do a reboot if you are tracing a slow boot scenario.
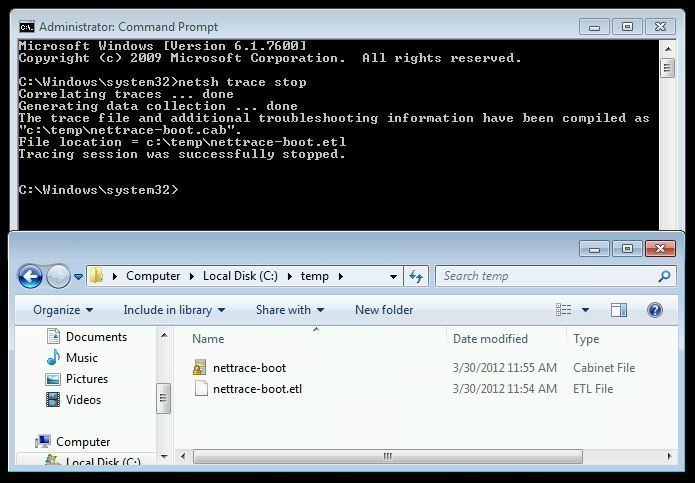
3. Open an elevated command prompt and run: “netsh trace stop”
Your trace will be stored in c:\temp\nettrace-boot.etl**or where ever you saved it. You can view the trace on another machine using netmon.
The longer version:
I will do this trace for a slow boot scenario – it works fine for non reboot scenarios too, just reproduce the issue and then stop the trace.
1. Open an elevated command prompt and run: “netsh trace start persistent=yes capture=yes tracefile=c:\temp\nettrace-boot.etl” (make sure you have a \temp directory or choose another location).
2. Reboot the client machine.
3. Log on and stop the trace using: “netsh trace stop” (from an elevated prompt).
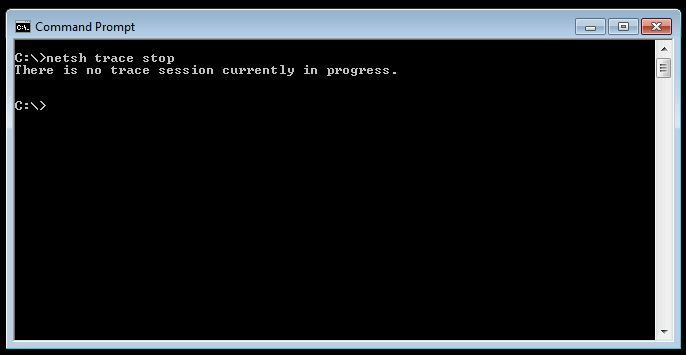
If you forget to elevate the prompt you will get this:
Now that you have the trace, you can take it to a machine where installing netmon is more appropriate to view the data. For customers, I capture using the netsh switch then get permission to view the data on my machine where I have netmon installed. Netmon allows us to choose .etl as a file to open as if it was an .cap file from a traditional trace.
When you open the file you might find that it looks a bit rubbish at first:

All you need to do is go to the tools > options tab so that you can tell netmon which parsers to use to convert the trace:
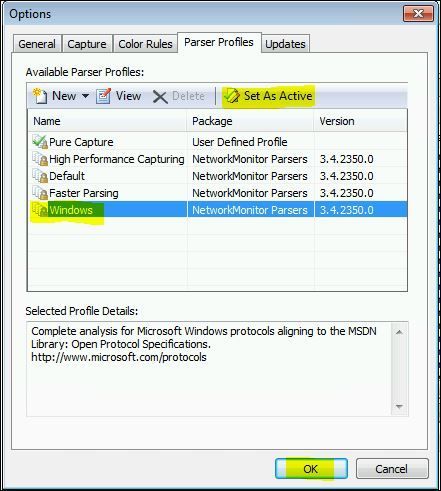
Choose the Windows parsers and dont forget to click “set as active” before you click OK or nothing will happen.
Now the output is ready for you to analyse:

I can see above, the DHCP discover packets have been parsed correctly (and… that we arnt getting a response from a DHCP server ).
That’s about all there is to it. Hope this is useful for you.
Author: Chad Duffey [MSFT]
Tech Reviewed: Enamul Khaleque [MSFT]